Prometheus Support
Metrics
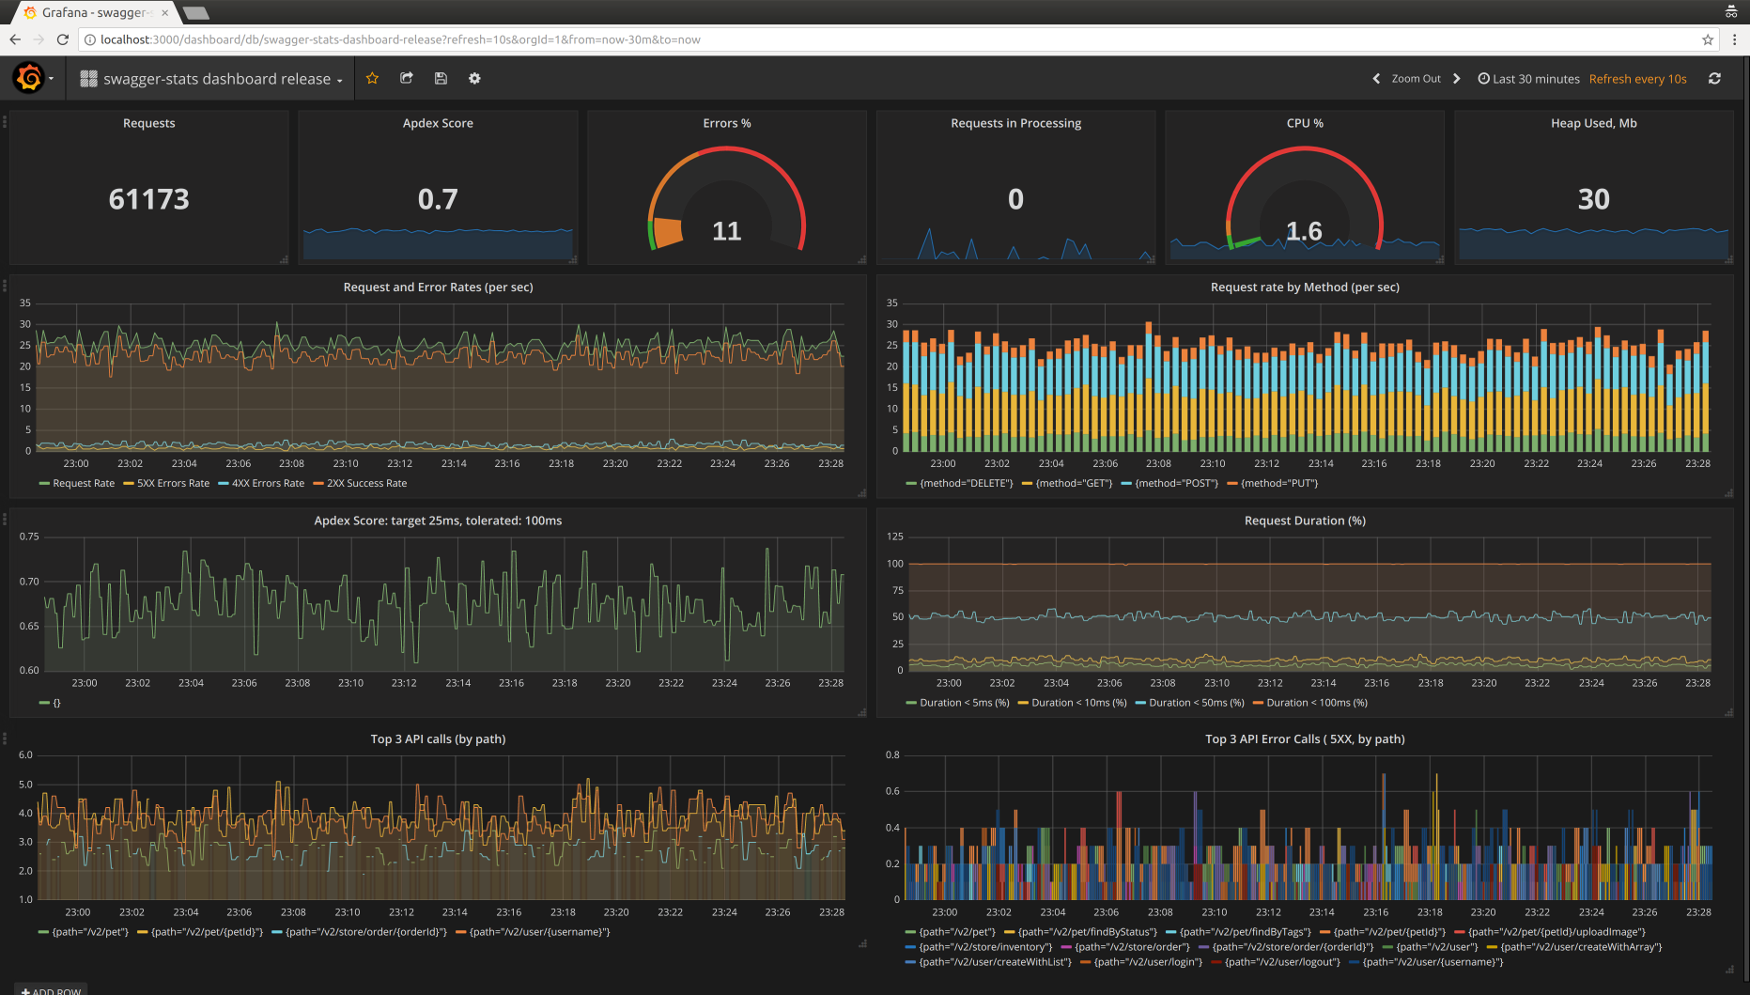
swagger-stats exposes metrics in Prometheus format, so you may use Prometheus and Grafana for API monitoring and alerting
swagger-stats exposes Prometheus metrics via /swagger-stats/metrics:
GET /swagger-stats/metrics
The following metrics are provided:
| Name | Type | Labels | Description |
|---|---|---|---|
api_all_request_total | counter | - | The total number of all API requests received |
api_all_success_total | counter | - | The total number of all API requests with success response |
api_all_errors_total | counter | - | The total number of all API requests with error response |
api_all_client_error_total | counter | - | The total number of all API requests with client error response |
api_all_server_error_total | counter | - | The total number of all API requests with server error response |
api_all_request_in_processing_total | gauge | - | The total number of all API requests currently in processing (no response yet) |
nodejs_process_memory_rss_bytes | gauge | - | Node.js process resident memory (RSS) bytes |
nodejs_process_memory_heap_total_bytes | gauge | - | Node.js process memory heapTotal bytes |
nodejs_process_memory_heap_used_bytes | gauge | - | Node.js process memory heapUsed bytes |
nodejs_process_memory_external_bytes | gauge | - | Node.js process memory external bytes |
nodejs_process_cpu_usage_percentage | gauge | - | Node.js process CPU usage percentage |
api_request_total | counter | method path code | The total number of all API requests |
api_request_duration_milliseconds | histogram | method path code le | API requests duration |
api_request_size_bytes | histogram | method path code le | API requests size |
api_response_size_bytes | histogram | method path code le | API response size |
Getting Prometheus Metrics Sample
$ curl http://<your app host:port>/swagger-stats/metrics
# HELP api_all_request_total The total number of all API requests received
# TYPE api_all_request_total counter
api_all_request_total 302

# HELP api_all_success_total The total number of all API requests with success response
# TYPE api_all_success_total counter
api_all_success_total 267

# HELP api_all_errors_total The total number of all API requests with error response
# TYPE api_all_errors_total counter
api_all_errors_total 35

. . . .

# HELP api_request_total The total number of all API requests
# TYPE api_request_total counter
api_request_total{method="GET",path="/v2/pet/findByStatus",code="200"} 13
api_request_total{method="GET",path="/v2/store/order/{orderId}",code="200"} 16
api_request_total{method="GET",path="/v2/store/inventory",code="200"} 16
api_request_total{method="GET",path="/v2/user/{username}",code="200"} 18
api_request_total{method="POST",path="/v2/pet/{petId}",code="404"} 1
api_request_total{method="POST",path="/v2/pet/{petId}/uploadImage",code="200"} 18
api_request_total{method="POST",path="/v2/pet",code="200"} 16
api_request_total{method="PUT",path="/v2/user/{username}",code="200"} 12
api_request_total{method="GET",path="/v2/pet/findByTags",code="200"} 15

. . . .
# HELP api_request_duration_milliseconds API requests duration
# TYPE api_request_duration_milliseconds histogram
api_request_duration_milliseconds_bucket{le="5",method="GET",path="/v2/store/order/{orderId}",code="200"} 1
api_request_duration_milliseconds_bucket{le="10",method="GET",path="/v2/store/order/{orderId}",code="200"} 1
api_request_duration_milliseconds_bucket{le="25",method="GET",path="/v2/store/order/{orderId}",code="200"} 3
api_request_duration_milliseconds_bucket{le="50",method="GET",path="/v2/store/order/{orderId}",code="200"} 7
api_request_duration_milliseconds_bucket{le="100",method="GET",path="/v2/store/order/{orderId}",code="200"} 16
api_request_duration_milliseconds_bucket{le="250",method="GET",path="/v2/store/order/{orderId}",code="200"} 16
api_request_duration_milliseconds_bucket{le="500",method="GET",path="/v2/store/order/{orderId}",code="200"} 16
api_request_duration_milliseconds_bucket{le="1000",method="GET",path="/v2/store/order/{orderId}",code="200"} 16
api_request_duration_milliseconds_bucket{le="2500",method="GET",path="/v2/store/order/{orderId}",code="200"} 16
api_request_duration_milliseconds_bucket{le="5000",method="GET",path="/v2/store/order/{orderId}",code="200"} 16
api_request_duration_milliseconds_bucket{le="10000",method="GET",path="/v2/store/order/{orderId}",code="200"} 16
api_request_duration_milliseconds_bucket{le="+Inf",method="GET",path="/v2/store/order/{orderId}",code="200"} 16
api_request_duration_milliseconds_sum{method="GET",path="/v2/store/order/{orderId}",code="200"} 911
api_request_duration_milliseconds_count{method="GET",path="/v2/store/order/{orderId}",code="200"} 16
. . . .
2
3
4
5
6
7
8
9
10
11
12
13
14
15
16
17
18
19
20
21
22
23
24
25
26
27
28
29
30
31
32
33
34
35
36
37
38
39
40
41
42
43
44
45
Example Prometheus scrape configuration
Simple scrape
scrape_configs:
  - job_name: 'sws-spectest'
    scrape_interval: '10s'
    metrics_path: '/swagger-stats/metrics'
    static_configs:
      - targets: ['localhost:3040']
2
3
4
5
6
Scrape with basic authentication enabled
  - job_name: 'sws-authtest'
    scrape_interval: '10s'
    metrics_path: '/swagger-stats/metrics'
    static_configs:
      - targets: ['localhost:3050']
    basic_auth:
      username: 'swagger-stats'
      password: 'swagger-stats'
2
3
4
5
6
7
8
Grafana Dashboards
swagger-stats Grafana Dashboards are published at https://grafana.com/dashboards?search=swagger-stats
Prometheus Queries
Examples of Prometheus Queries using swagger-stats metrics
Get Request Rate, Error Rate, Success Rate
sum (irate(api_request_total[1m]))

sum (irate(api_request_total{code=~"^5..$"}[1m]))

sum (irate(api_request_total{code=~"^4..$"}[1m]))

sum (irate(api_request_total{code=~"^2..$"}[1m]))
2
3
4
5
6
7
8
Get % of errors
( api_all_errors_total / api_all_request_total ) * 100
Get Apdex Score
How Apdex Score is calculated: Apdex Score
(
  sum(irate(api_request_duration_milliseconds_bucket{le="25",code=~"^2..$"}[1m]))
+
  (sum(irate(api_request_duration_milliseconds_bucket{le="100",code=~"^2..$"}[1m])) / 2)
) / sum(irate(api_request_duration_milliseconds_count[1m]))
2
3
4
5
Get Apdex Score Trend
(
  sum(irate(api_request_duration_milliseconds_bucket{le="25",code=~"^2..$"}[1m]))
+
  (sum(irate(api_request_duration_milliseconds_bucket{le="100",code=~"^2..$"}[1m]))/2)
) / sum(irate(api_request_duration_milliseconds_count[1m]))
2
3
4
5
Get Request Rate by Method
sum by(method) (irate(api_request_total[1m]))
Get % of request answered within threshold, over time
Use
le="XX"to set threshold, i.e.le="25"for % of request answered under 25 msec. Values ofleshould be from the list of bucket values specified in swagger-stats optiondurationBuckets
( sum(irate(api_request_duration_milliseconds_bucket{le="25"}[1m])) / sum(irate(api_request_duration_milliseconds_count[1m])) ) * 100
Get Top 3 API Calls by Path, over time
topk(3, sum(irate(api_request_total[1m])) by (path))
Get Top 3 5XX Errors By Path, over time
topk(3, sum(irate(api_request_total{code=~"^5..$"}[1m])) by (path))
Get Node.js process CPU Usage %
nodejs_process_cpu_usage_percentage
Get Node.js process Used Heap in MB
(nodejs_process_memory_heap_used_bytes)/1048576
Scraping with multiple PM2 processes
Based on this gist - kudos!
When you use a process manager such as PM2 in 'cluster' mode, only one process/instance receives the API call to collect metrics. Then you need to use IPC (interprocess communication) to gather statistics from other instances and aggregate them.
You can find PM2 IPC documentation here.
In this case we're using pm2.launchBus() to open an Axon Sub Emitter message bus. It's a UNIX socket message bus that Node natively supports via process.send(). From the instance that gets the metrics request (let's call it the 'master node'), we use pm2.sendDataToProcessId() towards each other instance to gather metrics - which in turn each respond via process.send().
Once we have gathered metrics from every instance, we use promClient.AggregatorRegistry.aggregate() to create the aggregated response and send it back to the client.
This kind of multithreaded/async code is not without dangers - we need to
- carefully register and deregister event listeners to prevent memory leaks
- use timeouts so that the request won't get stuck
- use unique request IDs so that when multiple metric requests are received, the IPC responses won't be mixed up (often, metrics collection can last multiple seconds!)
- catch errors in async code and act on them to prevent unhandled rejections in promises
The below code is in Typescript for type clarity - just remove type definitions if you're using ES2015+. It's a bit spaghetti, with the main function at the end.
import * as swStats from 'swagger-stats';
import * as pm2Cb from 'pm2';
/* if you use Bluebird, it makes using PM2 API easier, creating *Async functions */
const pm2 = Promise.promisifyAll(pm2Cb) as any;
import * as uuidv4 from 'uuid/v4';

/** Total timeout for workers, ms */
const TIMEOUT = 2000;
const promClient = swStats.getPromClient();
/** The global message topic for gathering Prometheus metrics */
const TOPIC = 'get_prom_register';
/** Singleton instance of PM2 message bus */
let pm2Bus;
const instanceId = Number(process.env.pm_id);

/* Info returned by pm2.list() */
interface PM2InstanceData {
    pm_id: number;
}

/** Response packet sent to the master instance */
interface ResponsePacket {
    type: string;
    data: {
        instanceId: number;
        register: any;
        success: boolean;
        reqId: string;
    };
}

/** IPC request packet sent from the master instance to the others */
interface RequestPacket {
    topic: 'get_prom_register',
    data: {
        /** ID if the master instance */
        targetInstanceId: number;
        /** Unique request ID to prevent collisions from multiple requests */
        reqId: string;
    }
}

/** Every process listens on the IPC channel for the metric request TOPIC,
responding with Prometheus metrics when needed. */
process.on('message', (packet: RequestPacket) => {
    try {
        if (packet.topic === TOPIC) {
            process.send({
                type: `process:${packet.data.targetInstanceId}`,
                data: {
                    instanceId,
                    register: promClient.register.getMetricsAsJSON(),
                    success: true,
                    reqId: packet.data.reqId,
                },
            } as ResponsePacket);
        }
    } catch (e) {
        console.error("Error sending metrics to master node", e);
    }
});

async function requestNeighboursData(instancesData: PM2InstanceData[], reqId: string) {
    const requestData: RequestPacket = {
        topic: TOPIC,
        data: {
            targetInstanceId: instanceId,
            reqId
        }
    };

    let promises = [];
    for (let instanceData of Object.values(instancesData)) {
        let targetId = instanceData.pm_id;
        // don't send message to self
        if (targetId !== instanceId) {
            promises.push(pm2.sendDataToProcessIdAsync(targetId, requestData)
                .catch((e) => console.error(e)));
        }
    }

    // Resolves when all responses have been received
    return Promise.all(promises);
}

/** Master process gathering aggregated metrics data */
async function getAggregatedRegistry(instancesData: PM2InstanceData[]) {
    if (!instancesData || !instancesData.length) {
        return;
    }

    // assigning a unique request ID
    const reqId = uuidv4();

    const registryPromise = new Promise<any>((resolve, reject) => {
        const instancesCount = instancesData.length;
        const registersPerInstance = [];
        const busEventName = `process:${instanceId}`;
        // master process metrics
        registersPerInstance[instanceId] = promClient.register.getMetricsAsJSON();
        let registersReady = 1;

        const finish = () => {
            // deregister event listener to prevent memory leak
            pm2Bus.off(busEventName);
            resolve(promClient.AggregatorRegistry.aggregate(registersPerInstance));
        };

        // we can only resolve/reject this promise once
        // this safety timeout deregisters the listener in case of an issue
        const timeout = setTimeout(finish, TIMEOUT);

        /** Listens to slave instances' responses */
        pm2Bus.on(busEventName, (packet: ResponsePacket) => {
            try {
                if (packet.data.reqId === reqId) {
                    // array fills up in order of responses
                    registersPerInstance[packet.data.instanceId] = packet.data.register;
                    registersReady++;

                    if (registersReady === instancesCount) {
                        // resolve when all responses have been received
                        clearTimeout(timeout);
                        finish();
                    }
                }
            } catch (e) {
                reject(e);
            }
        });
    });

    // request instance data after the response listener has been set up
    // we are not awaiting, resolution is handled by the bus event listener
    requestNeighboursData(instancesData, reqId);

    return registryPromise;
}

/** Main middleware function */
export default async function swaggerStatsMetrics(req, res, next) {
  try {
      // create or use bus singleton
      pm2Bus = pm2Bus || await pm2.launchBusAsync();
      // get current instances (threads) data
      const instancesData = await pm2.listAsync();
      if (instancesData.length > 1) {
          // multiple threads - aggregate
          const register = await getAggregatedRegistry(instancesData);
          res.send(register.metrics());
      } else {
          // 1 thread - send local stats
          res.send(swStats.getPromStats());
      }
  } catch (e) {
      throw new TechnicalError(e);
  }
};
2
3
4
5
6
7
8
9
10
11
12
13
14
15
16
17
18
19
20
21
22
23
24
25
26
27
28
29
30
31
32
33
34
35
36
37
38
39
40
41
42
43
44
45
46
47
48
49
50
51
52
53
54
55
56
57
58
59
60
61
62
63
64
65
66
67
68
69
70
71
72
73
74
75
76
77
78
79
80
81
82
83
84
85
86
87
88
89
90
91
92
93
94
95
96
97
98
99
100
101
102
103
104
105
106
107
108
109
110
111
112
113
114
115
116
117
118
119
120
121
122
123
124
125
126
127
128
129
130
131
132
133
134
135
136
137
138
139
140
141
142
143
144
145
146
147
148
149
150
151
152
153
154
155
156
157
158
← API